Editor's note: This story has been updated since it was first posted to correct an error in B.C.'s population growth figure.
The total population of the North Shore’s three municipalities hit 181,306 in 2016, a growth of 3.3 per cent since 2011.
Statistics Canada released its first batch of data from the 2016 census on Wednesday morning, offering data on population changes, the total number of dwellings and whether they’re lived in.
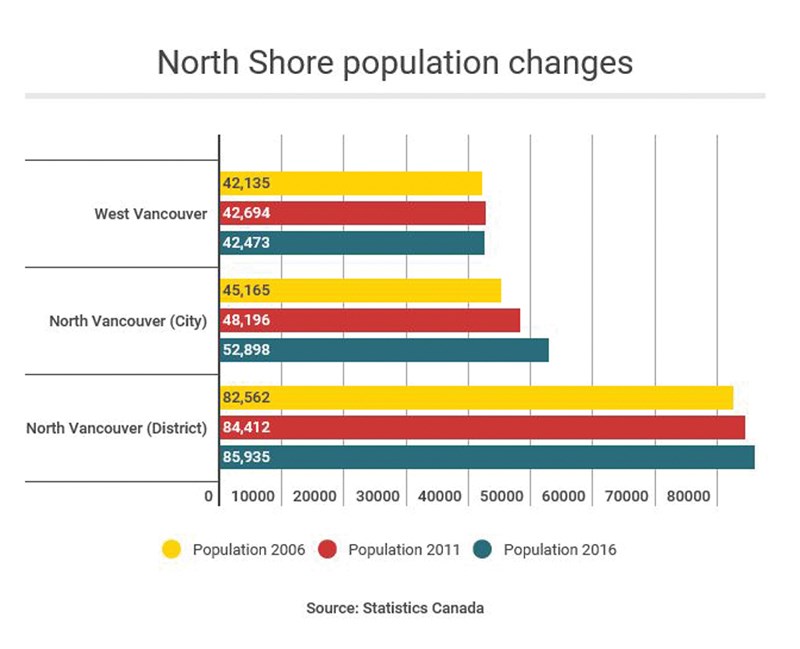
The District of West Vancouver’s population, according to the census, is 42,473 a drop of 0.5 per cent since 2011.
The City of North Vancouver, which had 52,898 residents on census day last year, was one of the fastest growing in the region at 9.8 per cent since the last census.
The District of North Vancouver grew by 1.8 per cent in the last five years, to 85,935 people.
The average growth rate for municipalities in Metro Vancouver since 2011 was 6.5 per cent. In that time, the province of B.C. grew to B.C. grew to 4,648,055 or 5.6 per cent.
The fastest growing communities in the Lower Mainland were Langley at 12.6 per cent, Surrey at 10.6 per cent and Coquitlam, which grew 9.8 per cent. Regionally, Squamish grew by 2,354 people or 13.7 per cent.
“(Population growth) is related to where affordable, adequate housing is in the city, particularly for local incomes,” said Andy Yan, director of SFU’s city program.
Within the cities, the population has mainly been increasing around transit hubs, something Yan noted is a positive sign.
“Where you see the pockets of population increase are in the census tracts that are, for the most part, very transit accessible,” he said. “There’s actually a good news element to it because they are following what the (official community plans) are wanting to accomplish in terms of a more compact, urban area. That’s a good sign that we’re trying to reach some of our sustainability goals.”
The census data also reveals the split between total private residences and ones not lived in by people captured by the census. It could be because they have been left empty, they are secondary homes whose owners spend most of their time elsewhere or the owners/renters are not Canadian citizens or permanent residents.
West Vancouver topped that list in the Lower Mainland with 9.2 per cent non-resident occupied homes. The city came in at 6.7 per cent and the district 4.6 per cent.
By comparison, in Vancouver, where the city is soon to be levying a tax against empty homes, the non-resident occupancy rate is 8.2 per cent.
“So, you’re way higher. Congratulations,” Yan said.
Not only did the number of people living in West Vancouver go down, so too did the number of homes in the district, which actually dropped by 0.1 per cent.
“They’re actually losing homes. Go figure. I didn’t expect that,” Yan said.
That could be, in part, a result of people buying two lots and consolidating them, Yan said.
The city experienced a proportionate jump in the number of units at 9.2 per cent and the district has 2.8 per cent more units of housing than it did five years ago.
The population numbers differ somewhat from the estimates released by BC Stats last month showing the North Shore’s total population in 2016 was 180,319.
This is just the first batch of data released by Statistics Canada from the 2016 census. Over the course of the year, the agency is schedule to release its tabulations on age and sex of residents, the types of dwellings they live in, family status, languages spoken, income, immigration and ethnocultural diversity, education, labour and commuting patterns. The census was conducted on May 10 last year.


