Air pollution is a silent killer that claims the lives of seven million people every year on this planet.
It’s a serious problem, especially in the developing world where wood or coal are used for cooking, and the advent of low-cost monitors to detect the smallest particles of pollutants that can lead to health problems peaked the interest of UNBC environmental science professor Dr. Peter Jackson.
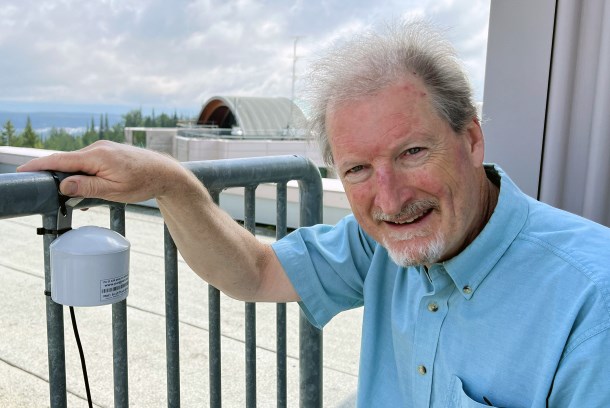
Six years ago, Jackson and graduate student Brayden Nilson began researching the capabilities and accuracy of $300 air-quality sensors as compared to $30,000 sensors used by government agencies to track the spread of air pollution.
The UNBC researchers partnered with Environment and Climate Change Canada to set up a network of the cheaper sensors at hundreds of locations across the country to produce an internet-based national air quality map that provides real-time counts of fine particulates detrimental to health.
The low-cost sensors detect particles 2.5 microns in diameter (PM2.5) that are small enough to pass into the lungs and can lead to breathing difficulties, especially for people who suffer from asthma or chronic obstructive pulmonary disease (COPD).
“I’ve been following the development of low-cost air quality monitoring for a while and for $300 you can buy a monitor that is almost as good as a government monitor, which is pretty exciting because it means you can put them all over the place and put them in small towns that wouldn’t have monitors,“ said Jackson.
There are now 50 air quality monitors in Prince George (using sensors sold under brand names Purple Air and Air Quality Egg) providing measurements for the web-based map.
Virtually every neighbourhood in the city is covered, which gives residents accurate air pollution measurements. The BC Environment gold-standard monitor used to correct the cheaper monitors is mounted on the roof of the Plaza 400 building at Fourth Avenue and Queensway.
With smoke from wildfires in the region a growing health concern, people can use the map to determine if they should go for a run outdoors or minimize physical activity and just stay inside with the windows closed to keep from breathing harmful air.
“Wildfire smoke is a complex mixture of pollutants, but PM2.5 is a big part of smoke and the PM2.5 monitors pick up the wildfire smoke really well, so the map has been used a lot all over Canada, especially back east,” said Jackson.
“It’s good to know what you’re being exposed to, so you can plan your activities accordingly, especially if you know you’re prone to having issues with air pollution.”
Users of the map can add a layer to pinpoint where wildfire smoke models forecast it to spread.
Nilson’s masters thesis in Science in Natural Resources and Environmental Studies at UNBC was based on improving the quality of data from monitoring sensors. He also developed a French-language version of the air quality map that has proved popular with heath science professionals in Quebec.


