The year 2017 was historic for Canadians, of sorts. Since the start of the year, Statistics Canada has been releasing massive batches of data collected following the return of the long-form census in 2016.
So what did we learn in our year of self-reflection?
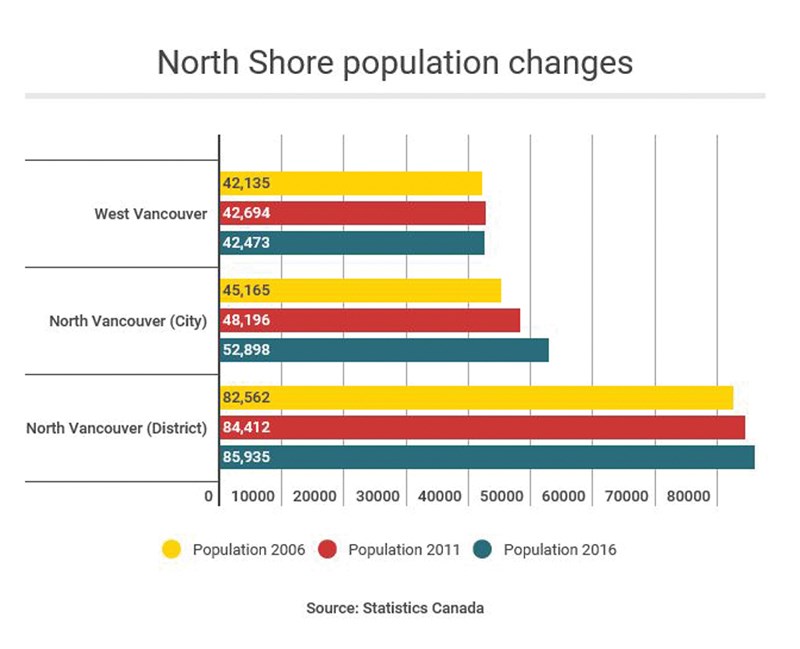
The North Shore has grown by 3.3 per cent since 2011, about half the Metro Vancouver average. We are still among the most car-dependent residents of Metro Vancouver. People older than 65 are the fastest growing segment of our population. And the number of people who commute to the North Shore is at an all-time high while the percentage of people who commute off the North Shore actually declined.
West Vancouver was an outlier in many ways. It’s one of only three municipalities in B.C. with a population in decline and also one of only a few where incomes are declining (and yet housing prices are among the highest in Canada).
The census reveals many of the struggles our society now grapples with. It’s up to us to use this data to change course where it’s needed.
We encourage everyone to visit the StatCan website and see what they can glean themselves.
But it’s our planners and our policy makers we now hope are really poring over the spreadsheets and paying particular attention to the fact that almost half the renters here are paying more than they can afford. Ignorance of this fact – like ignorance of the law – can no longer be excused. We need to ensure the North Shore remains a community, not just a real estate play.
There’s enough data in these releases for us to chew on and analyze until the next full census is done in 2021. But let’s hope when the next release happens in 2022, we will have demonstrated that we didn’t collect this data just for interest’s sake.
What are your thoughts? Send us a letter via email by clicking here or post a comment below.


