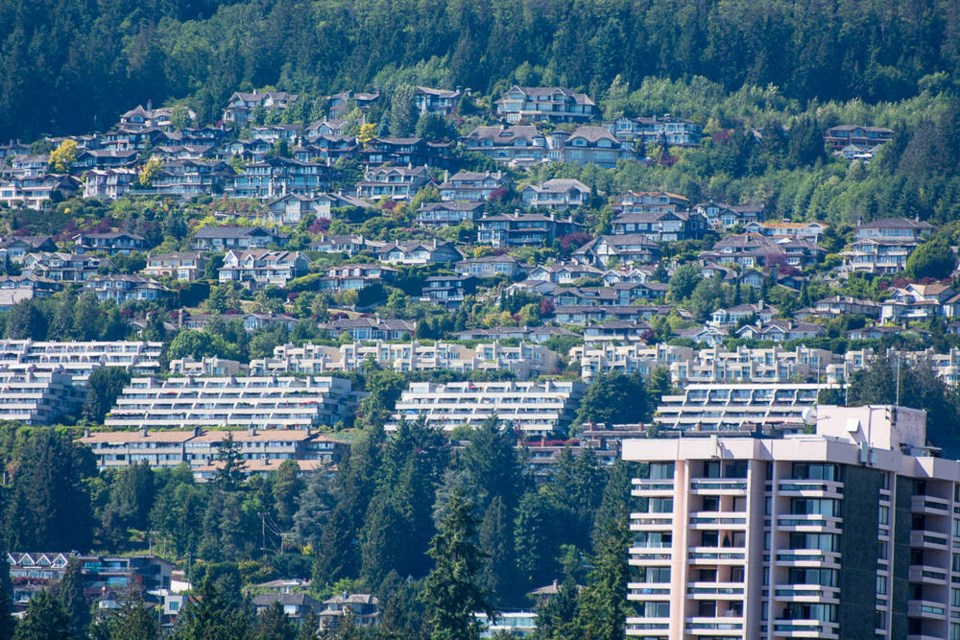
Across the North Shore, the gap between high- and low-income earners is among the widest in the country.
West Vancouver is the second-most unequal place to live, behind Westmount, Que., according to an analysis of 418 municipalities with more than 10,000 people, using 2020 Statistics Canada data for adjusted after-tax household income.
The analysis was done by Local News Data Hub, a collaboration between Toronto Metropolitan University’s school of journalism and the Canadian Press wire service.
Following Vancouver (11th) and Saltspring Island (16th), the City of North Vancouver ranked 17th most unequal, tied with Beaconsfield, Que. In the 24th spot is North Vancouver District, which tied with Waterloo, Ont.
Following those are municipalities like Burnaby and Whistler, tied at 33rd. Way down the list are places like Langley at 316th and Comox at 348th.
The comparisons were made using what’s called the Gini index, an internationally recognized tool that statisticians use to measure how income is distributed across a given society.
It’s a very complicated statistical equation, and a measure that ranges from zero to one, explains Carly Penrose, who authored the analysis.
“If a Gini coefficient is equal to zero, it means that every single person in this society is making the exact same amount of money. They call that perfect equality, which realistically doesn’t exist,” she said. “And then a [score of] one means one person in an entire society is making all of the money and everyone else is making nothing.”
In Westmount, Que., the Gini measure is 0.54. In West Van it is 0.51. The measure is 0.35 in the City of North Vancouver and 0.32 in North Van District.
Other sources of income and wealth not captured by the data
While varied levels of income can measure the economic disparity between many citizens, other sources of income and wealth are not captured by the Gini index.
Things like capital gains aren’t counted, Penrose noted. “They only have the data that they get from tax returns.”
The fact that certain incomes – such as those gained in other countries – are not accounted for can also skew inequality data. This effect was more pronounced in smaller, wealthier communities, Penrose said.
“I found in big cities … it’s easier to have those small differences [not] show up as much, but for smaller places, like West Vancouver and Westmount, and places like that, it was a tricky thing to measure.”
In general, Penrose found that bigger cities tended to have more inequality. “There’s more people which means more variation,” she said, adding that urban centres tend to be home to corporate headquarters, which means higher-paid workers live nearby.
But there are also smaller communities with historically high incomes.
“Very wealthy suburbs tended to be higher. There was no clear explanation for it. But I read that, for example, in Westmount, it is on a mountain,” Penrose said. “The people at the centre of the area make very high income, but the people who live in wards that are right next to it are quite low income … inequality can be presented in that way.”


