His maps are as much art as they are essential geography.
The newest award-winning map by Jeff Clark, of Clark Geomatics, The Essential Geography of the Sea to Sky, is of particular interest to Sea to Sky locals.
"[It] captures the journey from the coastal waters of Howe Sound to the mountain ranges of Whistler,” Clark’s online map description reads.
The more you look at his maps, the more you see—like the Indigenous place names added throughout and the many peak names that local climbers cherish.
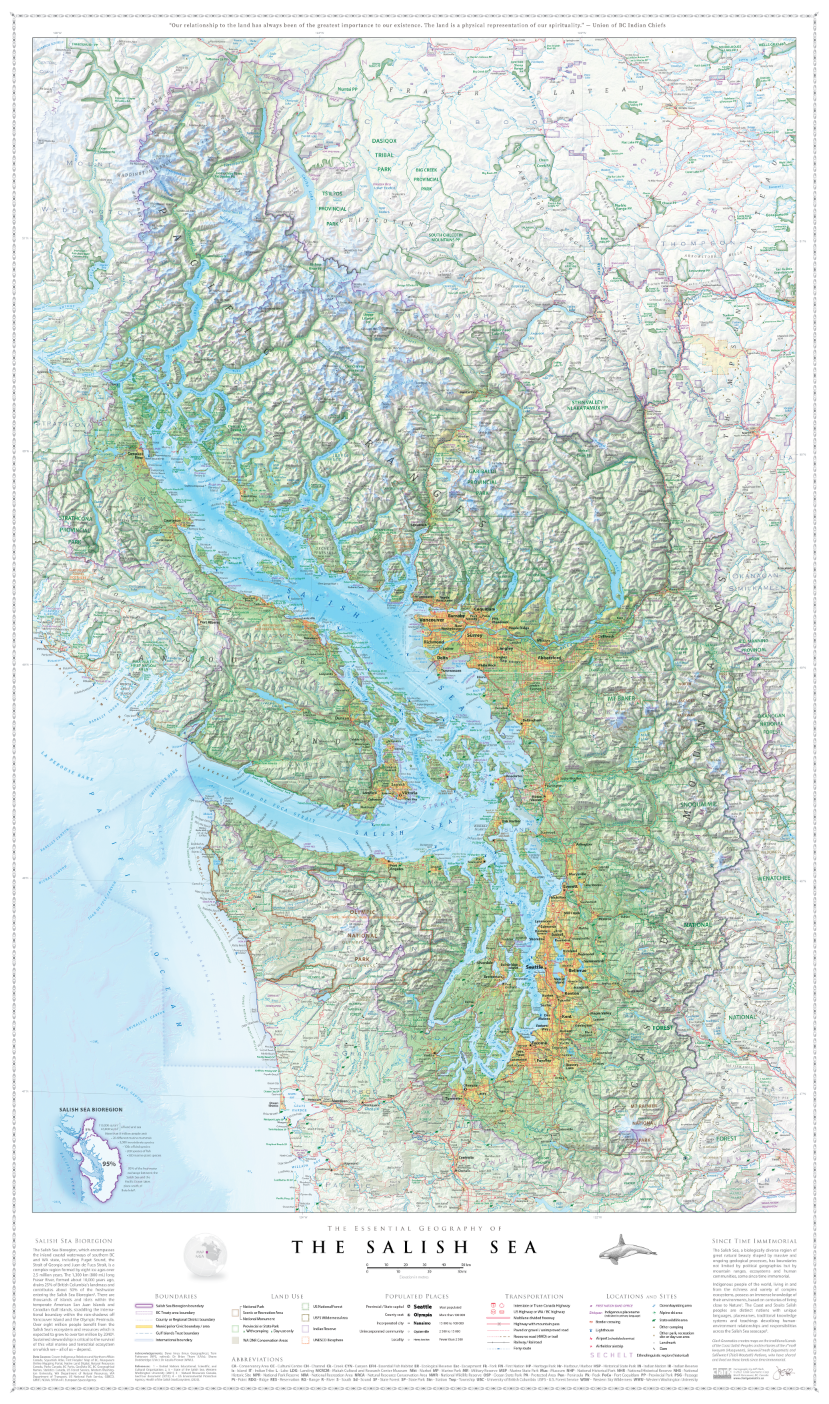
The Essential Geography of the Salish Sea map won "Best Reference Map " and "Best in Show" in the U.S.-based Cartography and Geographic Information Society's 2024 Annual Map Design Competition.
The Sea to Sky map, published in 2022, won the "Best Reference Map" category at the same competition that year.
Clark acknowledges he "geeks out" over the maps he creates, adding details that impact the viewer without them perhaps realizing it. For example, he added "a little yellow ... so that it looks like the sun is setting in the late afternoon—the sun's hitting the mountains," he says, pointing at spots on his Sea to Sky map, which he figures took hundreds of hours to create.
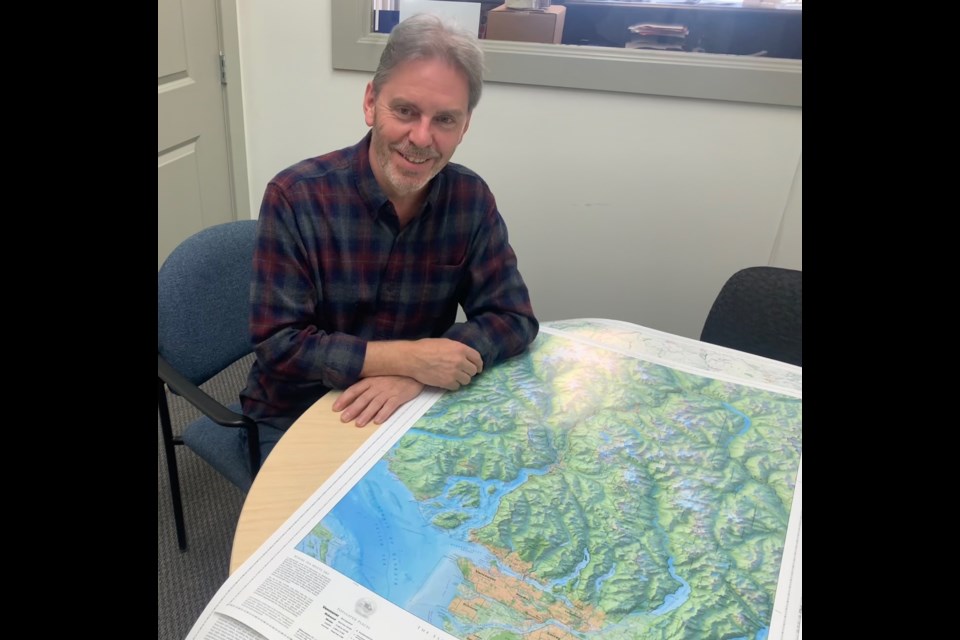
This week, with that map and the Salish Sea one spread out on the table before us, The Squamish Chief sat down with cartographer Clark to find out about his interest in maps, the craft that goes into creating them and what he hopes locals take away from them.
What follows is a version of that conversation edited for length and clarity.
Q: Where did your interest in maps come from? Were you interested in them as a kid?
A: I guess so. What kid didn't like looking at National Geographic? I was always looking at them. I think the big thing is that I am a geophysicist, that's my background, which means looking for gold, pretty much, if you are in Canada—mineral exploration. I did that for many years. Obviously, doing that, I came into contact with many a map, but they weren't maps that looked like this. They were maps of electric fields, gravity, magnetic fields and all that other stuff you use to find gold. Then, I went into geographic information systems, because of the boom and bust of the mineral exploration business.
I went back to school and took geographic information systems (GIS)—that's mapping, databases and computers, location-based analysis. Then I just started getting into maps, figuring out how to do this kind of thing for clients who have asked, “Hey, can you make me one of these?” That was in about 2008.
Courtesy of Jeff Clark, Clark Geomatics
Q: How does one go about making a map? Like this one here of the Salish Sea? What are the steps?
A: There are two main chunks of information here. One of them is all that nicely coloured background, and you see the mountains and all the shaded areas, that's called shaded relief. That's created from a thing called a digital elevation model, which is digital data of the landscape. So that's got almost a 3D aspect to it? So, you have got hills and valleys, and then you can add shadows to make it look realistic, which is what I've done here. And then on top of that, I took satellite data and created the land-cover glaciers—the green stuff. This purple zone is the Salish Sea drainage. So, all the water outside the purple line drains into the Salish Sea. It is like a big watershed.
Then there's a ton of what's called vector data. It's points, lines, polygons; that's all the roads that you see, all the dots, the camping symbols, all the line work, the cities, the parks, all that stuff that's all basically digital data from different places that I've merged to create this story.
So you're merging a whole pile of different data sets, making sure they all line up, things don't overlay each other, and then, after that, I put all these labels in, right? That's kind of time-consuming stuff sometimes. A label can take me 15 minutes to put in the right spot.
Q: What is the hardest part of the process?
A: Placing the labels and making sure that the map is readable. But also making sure that it's a good-looking map, because if it's not, you're not going to look at it. It's got to be optically or visually pleasing for you to actually go up to it and start to learn from it.
Q: What do you hope people take away from your maps?
A: I think what to take from it is the fact that you live in a beautiful area and, you know, get off the road. Get off the road. Go explore your backyard. It's beautiful and it's super accessible. Don't be afraid. Go and check things out. Appreciate it and appreciate the landscape and the story it's telling you.
Looking ahead, Clark says his next project will be a detailed map of Vancouver Island.
To find out more about his maps, go to www.clarkgeomatics.ca.
The maps sell for about $120 on his website. The Salish Sea map is here and the Sea to Sky map is here.
Clark gave The Squamish Chief one of each map. We will donate them to the first local teacher to email us at [email protected] with how they would use them in their classroom.


