Following a modest monthly increase, British Columbia’s workforce reported another mild expansion last month.
The number of people employed in the province rose by 6,600 people (up 0.2 per cent) from February to March, with year-over-year growth at 2.7 per cent.
Following last year’s lull, B.C. employment has since gained traction and outpaced the rest of the country.
That said, the unemployment rate rose by 0.3 percentage points to 5.5 per cent as labour supply out-paced employment growth. This was driven by population growth and an increase in labour force participation.
Part-time employment in the province declined by 2.4 per cent or 13,700 people, following the 1.6-per-cent month-to-month decrease reported in February.
Full-time employment rose by 0.9 per cent or 20,100 people. The Vancouver census metropolitan area saw no change in its employment level. The area’s unemployment rate jumped back to 5.6 per cent following a 0.5-per-cent decline in February.
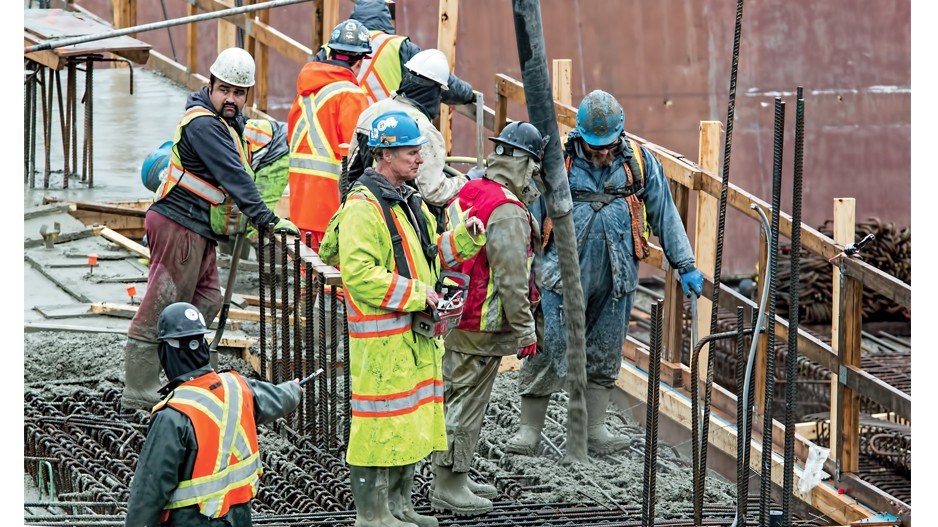
By sector, goods-producing industries led March employment growth with a 1.6-per-cent increase. All categories within goods-producing industries reported growth, and utilities saw the highest proportional monthly gain at 17 per cent (or 2,500 people).
Total employment in the services industries edged down by 0.1 per cent, with notable decreases in sectors such as information, culture and recreation (down 3.9 per cent or 5,800 people).
Sectors such as finance, insurance, real estate, rental and leasing experienced hiring growth (up 3.2 per cent), along with health care and social assistance (up 2.6 per cent).
In February 2024, the value of B.C.’s merchandise exports remained stable at about $4.5 billion, unchanged from the revised figure reported for the previous month.
In contrast, B.C. saw imports climb again in February, up for a second month in a row for an increase of 8.5 per cent to $6 billion. Overall, for the last 12 months, exports fell 14.3 per cent or $9.2 billion while imports declined 6.4 per cent or $5 billion.
Although the overall level of exports remained unchanged month to month, nine out of 11 categories saw a monthly increase in value. The largest increases were seen in metal and non-metallic mineral products (up 45.1 per cent) and forestry products and building and packaging materials (up 14.8 per cent). Balancing this out was a 12.9-per-cent decline in energy products and a 29.4-per- cent decline in metal ores and non-metallic minerals.
Over the last 12 months, six out of 12 categories saw a decline in export value, with the most significant decline observed in two categories: Energy products, which fell by 22.8 per cent or $5.7 billion, and forestry products, down 24.2 per cent or $3.7 billion. For context, the combined drop in export value reported by these two categories — $9.4 billion — was greater than the overall net decrease in export value of $9.2 billion.
On the imports side, 10 out of 11 categories saw a year-over-year increase. Leading the way was energy products (up 53.3 per cent), followed by aircraft and other transportation equipment parts (up 61.4 per cent) and metal ores and non-metallic minerals (up 113.1 per cent). The single category to report a monthly decline in imports was basic and industrial chemical, plastic and rubber products, which was down 4.4 per cent. Over the last 12 months, nine out of 12 categories saw lower import volumes.
Bryan Yu is chief economist at Central 1.


