The detached-home pendulum has swung into a buyer’s market, according to the monthly stats report from the Real Estate Board of Greater Vancouver (REBGV), released July 4.
REBGV said that slow sales, combined with an increase in home listings, have pushed the region's sales-to-listings ratio in the single-family sector down to 11.6 per cent. This is creeping into buyer’s market territory, as a balanced market is between 12 and 20 per cent.
Phil Moore, REBGV president, said. “With reduced demand, detached homes are entering a buyers’ market. This is allowing the supply of homes for sale to accumulate to levels we haven’t seen in the last few years. Rising interest rates, high prices and more restrictive mortgage requirements are among the factors dampening home buyer activity today.”
Supply improved in townhomes and condos, too, but not enough to take those sectors into a balanced market. At ratios of 24.9 per cent for townhomes and 33.4 per cent for condominiums, both housing types are still defined as seller’s markets, although less aggressively than in recent history.
Overall, MLS home sales in the region totalled 2,425 in June, a 37.7 per cent drop from June 2017, and a 14.4 per cent fall in just a month since the slight peak in May 2018. Last month’s transaction total was 28.7 per cent below the 10-year June sales average, and the lowest June total since 2012.
(Story continues below)
The sales slowdown is putting the brakes on overall price increases, with June’s composite benchmark price (all home types combined) 9.5 per cent higher than a year ago, but virtually flat compared with May 2018, at $1,093,600. However, this price change is very different when broken out by home type (see below).
It also masks wide variations between cities and neighbourhoods within the REBGV region. For example, composite benchmark prices in Whistler, Squamish, New Westminster and Pitt Meadows are all up more than 20 per cent year over year, whereas West Vancouver home prices are typically 4.3 per cent lower than a year ago.
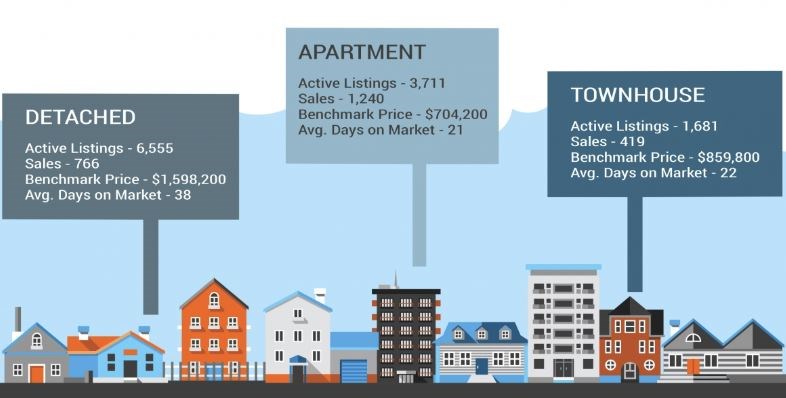
Sales and prices by property type
There were 766 Greater Vancouver detached home sales in June 2018, a 42 per cent decrease from June 2017 and 17.2 per cent lower than May’s 926 single-family sales.
REBGV is now benchmarking the price of a typical detached home at $1,598,200. This is just 0.7 per cent higher than June 2017 and a drop of 0.6 per cent from May 2018. The steepest detached-home price declines were seen in Vancouver West (West Side, Downtown West and West End), where the benchmark is 6.5 per cent lower than a year ago, and in West Vancouver, down 5.8 per cent. Bowen Island and the Sunshine Coast are the biggest trend-buckers, with detached prices rising year over year by 15.8 and 13.5 per cent respectively.
A total of 419 attached properties, such as townhomes and duplexes, were sold in the region last month – a 37.3 per cent drop from June 2017 and nearly 12 per cent lower than May this year.
With townhouses remaining in limited supply, prices have not declined in this market, although growth seems to be stalling. The benchmark price of an attached home is now pegged at $859,800, which is 15.3 per cent higher than June 2017 and is virtually unchanged from May 2018. Both Whistler and Squamish saw prices rise more than 30 per cent year over year in this sector, while the lowest annual price growth was seen in Tsawwassen at 4.7 per cent.
Greater Vancouver condo sales totalled 1,240 in June 2018, a 34.9 per cent year-over-year decrease and a month-over-month decline of 13.3 per cent.
Even though condo sales fell a little harder than townhomes, the stronger seller’s market and more constrained inventory is keeping prices on an upward trajectory – albeit at a slowing rate. The benchmark price for a condo across the region is $704,200, which is 17.2 per cent increase from June 2017 and a 0.4 per cent increase compared to May 2018.
Moore confirmed, “Price growth in our townhome and apartment markets is showing signs of decelerating.”
Maple Ridge is leading the annual condo price growth at a staggering 40.7 per cent, as prices in that historically more affordable region start to catch up with pricier areas. Pitt Meadows is following suite at 37.7 per cent, and Whistler condo prices are up 30.4 per cent. Six other areas – Burnaby North, Coquitlam, New West, Port Coquitlam, Port Moody and Squamish – all saw more than 20 per cent annual price rises in the condo sector. The weakest condo price growth was in Vancouver West, up 9 per cent.
Home prices vary widely in different areas throughout the region. To get a good idea of home prices in a specific location and by property type, check the detailed MLS® Home Price Index in the full REBGV statistics package.


